In all sectors, companies are dealing with an increased frequency and magnitude of disruptions. Businesses must quickly scale down and then ramp up their operations once demand returns. They have to switch product portfolios depending on the availability of components. Some of the events that have caused havock in the past decade include the Fukushima earthquake and tsunami in Japan, Suez Canal blockage, lockdowns related to Covid19 and variants, semiconductor shortages(link resides outside Axisto), staff shortages, war in Ukraine, exploding energy costs(link resides outside Axisto), high inflation.
Understandably, most of these disruptions took leadership teams by surprise. The worst of these disruptions have taken a toll on business output, revenue and profitability. Recovery can take months or even years.
Process mining provides the much-needed overview of the end-to-end supply chain and provides better insight and information for better, proactive collaboration internally and in the overall supply chain. Process mining also provides proposals for decisions with their consequences for real-time optimisation of flows.
(*) click here for introduction to process mining.
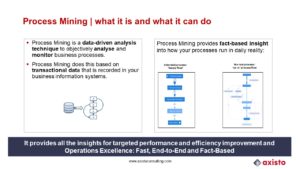
PROCESS MINING – WHAT IT IS AND WHAT IT CAN DO
It provides all insights for targeted performance & efficiency improvements: fast, end-to-end and fact-based.
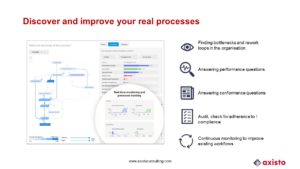
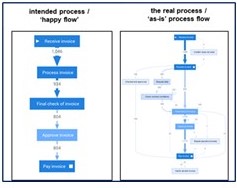
DISCOVER AND IMPROVE YOUR REAL PROCESSES
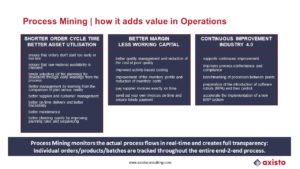
APPLICATIONS OF PROCESS MINING
FULL TRANSPARENCY
Instead of working with the designed process flow or the process flow that is depicted in the ERP system, process mining monitors the actual process at whatever granularity you want: end-2-end process, procure-2-pay, manufacturing, inventory management, accounts payable, for a specific type of product, supplier, customer, individual order, individual SKU. Process mining monitors compliance, conformance, cooperation between departments or between client, own departments and suppliers, etc.
OVERVIEW OF THE ENTIRE SUPPLY CHAIN
Dashboards are created to suit your requirements. These are flexible and can be easily altered whenever your needs change and/or bottlenecks shift. They create real-time insights into the process flow. At any time, you know, how much revenue is at stake because of inventory issues, what root-causes are and which decisions you can take and what their effects and trade-offs will be.
If supplier reliability is not at the target level at the highest reporting level, you can easily drill down in real-time to a specific supplier and a particular SKU to discover what is causing the problem in real-time. Suppliers could also be held to the best-practice service level of competitive suppliers.
MAKING INFORMED DECISIONS AND TAKING THE RIGHT ACTIONS
The interactive reports highlight gaps between actual and target values and give details of the discrepancies, figure A. By clicking on one of the highlighted issues, you can assign an appropriate action to a specific person, figure B. Or it can even be done automatically when a discrepancy is detected.
Figure A, details of the discrepancies. Figure B, pop up to create a task
And direct communication with respect to the action is facilitated in real-time, figure C.
Figure C, exchanging information.
WRAP UP
Process mining is an effective tool to optimise the end-2-end supply chain flows in terms of margin, working capital, inventory level and profile, cash, order cycle times, supplier reliability, customer service levels, sustainability, risk, predictability, etc. Because process mining monitors the actual process flows in real-time, it creates full transparency and therefore adds significant value to the classic BI-suites. Process mining can be integrated with existing BI-applications and can enhance reporting and decision-making.
Manufacturers that best navigate the challenges of the world they operate in have a number of characteristics in common.
1. A clear vision of how their manufacturing operation looks like and operates in three to five years’ time.
They have decided which markets and customers they want to serve and understand what it takes for their manufacturing operation to enable business success. They focus on a “vital few” strategic initiatives with clear deliverables, and timelines and drive consistent execution.
For most manufacturers business conditions are more volatile and ambiguous than ever. Therefore, they review on a regular basis their strategic initiatives in the context of developing conditions and adapt. However, their long-term course is stable.
2. An aligned operating model
Winning manufacturers align their operating model with their vision. They know that if they don’t, their defacto strategy (their day-to-day operation) will deviate from their intended strategy. And they keep organisational complexity low as complexity drives costs up and speed and flexibility down.
This means well-aligned and “leaned out” business processes, KPI’s that help to control the operation, unambiguous roles and responsibilities, decision power low in the organisation, a reporting structure that creates transparency and insight in the actual performance, and a meeting structure that facilitates effective, fact-based decision making.
3. Employees with a high level of ownership
Employees at all levels in the organisation feel co-owners of the company and demonstrate a relentless drive to eliminate performance bottlenecks.
They have the skills to be successful and make sure they acquire new skills in line with the evolving needs of the company.
4. Drive to eliminate complexity
Complexity creates costs and inflexibility. They consider each and every type complexity: product and service design, the design of production means, total cost of ownership of purchased goods and services, cost of ownership of a supplier, contractor or client,
5. Continuous investment in smart manufacturing
With an increasing digitalisation of their operations, they gain significantly in speed, flexibility, and productivity. They develop new business strategies and innovate products and services portfolios. In developing smart manufacturing, they not only focus on selecting the right technology, analytics programs, and algorithms but also nurture a digital culture and skills.
Ever since 2006 we have been supporting manufacturing companies to deliver on their vision. Please get in touch to explore how we could support you in becoming one of the winners.
CHALLENGE
Developing new products and introducing the industrial production processes to support them is highly complex, especially when you’re at the limits of manufacturing technology. Increasing market demand only raises the pressure further, since each and every product manufactured can be sold. Also, demand for new product types was growing very fast. It appeared a toxic combination.
We had already worked with this business unit to solve its manufacturing problems and enable it to become a more reliable supplier, now the management team asked us back in to help them improve their innovation reliability and reduce their time-to-market for new products.
The situation in the innovation-to-market department was complex. There was strong demand for additional product types and the market was shifting from B2B to B2C, which meant a shift in product requirements. On top of that, additional resources were required to address problems in production, and the department was constantly hiring additional new product development resources. Competition was growing, so speed was of the utmost importance, and the improvement targets were extremely high.
APPROACH
Our analysis, which we conducted in close cooperation with the client, revealed three main problem areas:
1. Portfolio management
The innovation portfolio was too big, its content was inconsistent and the priorities were regularly changing. This situation had developed because of poor business and operations planning and, as a consequence, poor technology and product roadmap planning.
2. Resource management
a. The organisation had created a self-inflicted resource bottleneck. The problem was caused by trying to manage too many portfolio projects at the same time and by allocating too many projects to limited resources. The result was plummeting productivity.
b. The constant inflow of new hires was creating a skills issue. There was no time to train them, and knowledge was not readily accessible for the new hires because very little had been documented.
3. Project management of innovation projects
A project management process had been defined for only 2 out of 5 project categories. And because of time pressures, people were cutting corners in projects and tollgate discipline was poor. This behaviour was creating rework and thus project delays. Project quality was suffering, and this in turn was causing production problems and an increase in customer complaints.
We worked with the client to set clear goals to increase innovation output by reducing time-to-market and improving project reliability. The time-to-market target was a reduction from an average of 23 months to just 9 months. We set an aggressive 6-month timetable for achieving these goals and formed joint teams to drive the changes. Because the three main problem areas were very much interdependent and the lead time was short, we ran four workstreams in parallel: (1) single project management, (2) portfolio management, (3) business planning and roadmapping, and (4) knowledge capture and design rules. We selected six pilot projects to introduce the new ways of working and deliver actual results.
We set up a project governance structure, including a review team, a project team and several workstream teams, and established milestone deliverables. We used a combination of “waterfall” and “agile” approaches to get things done.
THE IMPLEMENTATION
Performance improvement programmes must carefully balance human and technical aspects if they are to deliver significant, sustainable results. A critical aspect for sustainability is the development of a deep local ownership of the solutions to the problems. Therefore, we approached the challenge by ensuring the solutions were found by a process of co-creation right from the start.
The developers just didn’t have any time to spare, but speed was essential, so we started by slashing the volume of projects in the portfolio. Next, we set priorities and reduced the number of projects allocated to the developers. This was a tough process as there were many invested interests. However, this reconfirmed the analysis finding that the business had to get its strategic and operational planning right.
During the project we identified five different project categories, ranging from large, complex innovation projects down to factory support (crash actions). For each category, we designed and implemented project process maps, which included the project management methodology with team meetings, tollgate reviews, tollgate criteria, along with tools relevant at each stage in the project.
We designed and implemented a portfolio management process and system with clear roles and responsibilities, set up review teams for various project categories, established criteria to allow / refuse projects into the portfolio and encouraged an attitude of “killing” projects as early as possible to eliminate waste and maintain a manageable portfolio. We also designed a process for allocating resources.
In parallel, we implemented five different business planning and roadmap processes, including a technology roadmap, a product roadmap and an application roadmap. To support the development of knowledge and skills, we established a process to capture and document learnings from all projects, regardless of whether they had been successful, unsuccessful or ditched.
The results were impressive. Time-to-market dropped from 23 weeks to 11 weeks within 6 months, with plans in place to meet the target level of 9 weeks. Equally important, the results were sustainable because the root causes had been identified and eliminated, and the solutions locked into the Performance Management Systems (PMSs) developed during the project. The PMSs also included key performance indicators to give managers and employees ready access to the quantifiable information needed to make fact-based decisions, both as teams and individually, and to take pro-active and predictive action.
Throughout the implementation, a balanced combination of human and technical aspects drove the successes, and solutions were added to the PMS to support sustainability. By creating and communicating the right culture from the very start, we helped the client establish and communicate roles and responsibilities for employees at all levels. As the project progressed, employees began to see the value of their own contributions and to understand how their own performance influenced that of others, both within their discipline and beyond. As this understanding grew, a culture of accountability and collaboration evolved. Clear goals were communicated in a common language that everyone could understand, and employees embraced the new systems, processes and ways of working as their own.
Recession on the horizon? Based on our own research and research by Bain & Company, Harvard Business Review, Deloitte, Gartner and McKinsey, we formulate 7 actions to accelerate your profitability during and straight after a recession. Figure 1 shows how big the difference is between winners and losers. This does not only apply to EBIT, after a recession, winning companies are also able to make significant strides in market share.
Figure 1. “Winning companies accelerated profitability during and after the recession, while losers stalled” (Source: Bain & Company).
THE 7 MOST IMPORTANT ACTIONS TO BE AMONGST THE WINNERS
The key to success is preparation. Although, preparation is actually a wrong choice of words. Winners are winners, because they structurally sail close to the wind and have a clear vision. They are proactive, fast and decisive. They are financially prudent to absorb setbacks and seize opportunities as they arise. The seven actions below clearly indicate what that means in concrete terms.
1. CLEAR VISION AND ORGANISATIONAL ALIGNMENT
What will your business look like in three to five years? And in one year? What are the ‘vital few’ strategic initiatives and what is the path from strategy to concrete actions? Not only your leadership team needs to be committed and aligned, this applies to your entire organisation. Strategy Deployment is a powerful tool to maintain alignment and focus, monitor progress against plan and make rapid and appropriate adjustments in case of changing conditions.
2. UNDERSTAND YOUR STRATEGIC AND FINANCIAL POSITION
Mapping out your plans depends on your strategic and financial position (see figure 2).
Figure 2. Mapping out your plans requires an assessment of your company’s strategic and financial position (Source: Bain & Company).
3. FREE UP FINANCIAL RESOURCES
The focus is on aligning your spending with your vision and strategic initiatives; not blunt cost cutting. Zero-based Alignment is a good way to select and make lean those activities that are fully aligned. Non-aligned activities are stopped. The financial resources you free up can strengthen your balance sheet and/or support your investment agenda.
Currently we face high inflation. Supply chain problems and capacity bottlenecks are responsible for some of it, but their effect will dampen. Another cause is the sharp rise in energy costs as a result of the conflict in Ukraine and the resulting economic sanctions. In time, part of the costs will bounce back, but no longer to the old level. Costs will remain structurally higher due to urgency of the climate-change-driven energy transition. Furthermore, too much money is in circulation and its effect on inflation will also last longer.
The current high inflation can turn margins negative very quickly. Speed and flexibility are called for and selling prices have to go up. Raising prices in one go is difficult. It is better to do this in regular small steps. Possibilities depend on the strength of your brand and the market your company operates in. Make sure you retain the right customers in the process
4. RETAIN YOUR CUSTOMERS
Retaining customers is much cheaper than acquiring new ones. The margin impact is significant. Explore ways to help your customers through the economic downturn and particularly in the early upturn when the opportunities start to arise. Winners have already created the “currency” to invest. Just make sure you target the right customers.
5. PLAN FOR VARIOUS SCENARIOS
No one knows when and how a downturn will fully unfold and when the economy will start growing again. The winners have developed different scenarios, and they know how they should act in each scenario. This allows them to act quickly and decisively.
6. ACT QUICKLY AND DECISIVELY
Winning companies act quickly and decisively, in the downturn and particularly in the early upswing when the opportunities begin to emerge. They have already unlocked the financial resources to invest.
7. EMBRACE TECHNOLOGY
Not all companies have been equally aggressive in adopting new technologies. There are many opportunities here for improving efficiency or generating more value and thereby gaining a competitive advantage.
To emphasise the importance of technology even more.
Figure 3 shows the development of the total shareholder return before and after the recession of 2009/2010. It is clear to see how winners break away from the rest.
Figure 3. Companies with top-quartile revenue growth and cost control are rewarded by investors. Source: https://hbr.org/2019/05/how-to-survive-a-recession-and-thrive-afterward
Harvard Business Review found that 70% of companies failed to regain their pre-recession growth rate in the 3 years following the recession. Only 5% of companies manage to develop a growth rate that is consistently above that of their competitors (quarter-over-quarter simultaneous growth of sales and profit margin).
Digital leaders are 3x more likely to achieve revenue and margin growth that exceeds industry!
Maintenance maximises its value for the company by combining high asset effectiveness with low costs. We distinguish three main domains: (1) Reliability Management, (2) Reliability Improvement, and (3) Smart Maintenance.
1. Reliability Management
The domain of Reliability Management focuses on achieving the maximum reliability and availability of assets. In this domain, Maintenance and Production work hand in hand. They utilise the assets as intended and ensure that the necessary basic conditions are maintained. The quality of the interaction between Operators, Maintenance Technicians, and Maintenance Engineers determines the outcome.
Reliability Management is a combination of Corrective and Preventive/Condition-based Maintenance, where the behaviour of the assets, root causes of (potential) failures, performed maintenance work, and asset usage are carefully documented. There is a strong drive to continuously improve costs and efficiency within set frameworks. The insights provided by Reliability Management form the basis for Reliability Improvement
2. Reliability Improvement
Reliability Engineers and Engineers analyse the behaviour and usage of assets and enhance set frameworks by reducing the required maintenance of assets through improved maintenance routines, component redesign, and the introduction of new components. They prepare the organisation and assets for changing requirements, such as emissions and energy usage, as well as evolving market conditions, such as volume, product types, and the level of required flexibility.
3. Smart Maintenance
By utilising sensors and digital technologies, high-quality data becomes available, enabling the prediction of asset failure risks and the execution of maintenance precisely at the right time. Condition-based Maintenance transitions into Predictive Maintenance, which is carried out based on a forecast derived from the analysis and evaluation of critical parameters of asset degradation.
Other practical applications of digital tools within Maintenance include smart glasses, which allow technicians in the field to see where they need to perform which maintenance or to be remotely supported by specialists. Handheld devices, such as phones and tablets, provide work instructions and real-time information about spare parts, along with the ability to document performed work and observations immediately. RFID codes are used to identify assets with direct access to work orders and fault history. An integrated CMMS (computerised maintenance management system) or add-ons ensure efficient work order management.
CHALLENGE
Faced with rapidly ever tougher global competition, customer demands and cost pressures, the management team of this manufacturing and technology licensing company needed to increase both the effectiveness and efficiency of its innovation/R&D process in order to secure future market opportunities. The challenge was to increase the success rate of innovation projects and to cut the time from product concept to market introduction by half.
The company had a central R&D department, but there were also people working on innovation in the various plants across Europe. The people in the plants were closest to the customer and were working mainly on applications, whereas those in the central R&D department were doing ‘blue-sky’ development.
APPROACH
We began by working together with the client’s European business team, the R&D hub and a representation of process engineers from the various plants throughout Europe to analyse the “as is” situation. Three main issues were identified:
The customer release process was problematic because samples did not meet customer requirements, and this had created the perception of the company being an unreliable supplier for its customers.
The increased number of additives being used was creating in-house manufacturability issues and additional complexity both in the plants and in the supply chain.
Instability in the innovation/R&D portfolio contributed to an increasing time-to-market.
However, the definition and management of product platforms was strong, as was the skills level
throughout the innovation/R&D organisation. Therefore, there were some solid elements we could build on.
We worked as a joint team with the European business team, the R&D hub and process engineers from the plants to identify the root causes of problems, establish key levers to turn the situation around, and set clear and challenging targets. We set up a project governance structure, including a review team, a project team and various workstream teams, and established milestone deliverables. We used a combination of “waterfall” and “agile” project approaches to get things done. We selected nine pilot projects to introduce the new ways of working and deliver actual results.
THE IMPLEMENTATION
Performance improvement programmes must carefully balance human and technical aspects if they are to deliver significant, sustainable results. A critical aspect for sustainability is the development of a deep local ownership of the solutions to the problems. Therefore, we approached the challenge by ensuring the solutions were developed by a process of co-creation right from the start.
We worked on three workstreams in parallel:
Integrated strategic and operational planning
We started to break down organisational silos by bringing people together from the business team, the R&D hub and the plants in a series of workshops to craft an integrated strategic and operational planning process and to create a management and reporting structure. This meant that when technology and product roadmaps were generated they were better aligned with the market requirements and timelines. This prevented the development of applications and platforms becoming intertwined.
Transparent portfolio management
We achieved greater transparency and alignment through broadening the employees’ skill base and developing the use of existing IT tools. This meant that employees were better able to deal with uncertainty and to understand investment alternatives when “go–no go” decisions were being taken at stage gates along the innovation process. The development of effective behaviours in the project teams and around these tollgates was paramount throughout the implementation.
design rules and complexity
The principle of product platforms/product families was well understood and adhered to; however, new applications were not being managed well. A variety of additives was being used to achieve the same properties, and this was creating more and more complexity both in manufacturing and in the supply chain. In addition, rules such as design for manufacture were not tightly managed. In one case the company’s client was deeply impressed by the time-to-market of the new product they required, and the properties were spot on. However, the problem was that manufacturing the new product caused the production output to drop by 30%.
We ensured that the design rules were more explicitly defined, documented and accessible for everyone. We also introduced clear accountabilities and responsibilities to tighten the process for releasing additives and managing their variety.
The “as is” situation at the start of our joint project provided a good basis to build on. Many of the elements of world-class innovation management were already in place. The performance improvement was due mainly to an improved organisational alignment (and integration), more effective behaviours and, in particular, a more disciplined use of tools and methods.
Of course, there are a range of useful multi-project-management IT tools that can enhance visibility and enable more effective project portfolio management; however, the challenge here is to foster the behavioural change and teamwork that is required to build on the IT capability and not to rely solely on the IT tool to change the way people work.
Innovation, in contrast to health, safety and environmental management, demands risk-taking. DuPont’s Robert A Cooper sums up the requirement neatly: “Don’t manage the risk of failure. Manage the cost of failure.” Achieving this goal does not mean avoiding failure; it means failing clearly and early. To facilitate this behaviour, we developed a clearly defined and staged project management process with tollgates and explicit tollgate criteria. In fact, processes were designed for various project categories. “Go–no go” decisions could now be made based on facts. The development of effective behaviours in the innovation project teams and around these tollgates was paramount throughout the implementation.
CHALLENGE
A container terminal reached the limits of its capacity due to a further increase in the number of units to be processed. The terminal also had to become more attractive for ships to dock by faster loading and unloading for shorter waiting times. Furthermore, container ships are getting bigger, increasing complexity and time pressure at the terminal.
The assignment was to increase efficiency to make more inbound and outbound truck movements possible and to shorten ship waiting times.
APPROACH
Based on data from the ERP system regarding plan and actual over a representative period, the current working method of the terminal was reconstructed in our Planning Platform. The actual operation was visualised and animated, allowing the movements of each individual container to be tracked from position to position. The reconstruction was validated and further fine-tuned in a highly interactive process with the client.
Subsequently, with our Planning Platform, the current operational performance of the terminal was determined based on jointly identified Key Performance Indicators (KPIs), such as the mooring time per barge, the number of crane movements in/out and the number of truck movements in/out. Subsequently, a simulation of an optimised operation was performed using the exact same dataset and boundary conditions. The comparison of the KPIs of the current and optimised operations immediately gave a clear picture of the improvement potential.
In close collaboration with the client, the plan for a number of containers was then optimised step-by-step until the total was finally optimised. After each step, the improvement was measured against the identified KPIs.
Attaining world-class supply chain management and collaboration means developing and managing supply chains and partnerships so that your company is flexible and resilient, with response times and delivery performance that will beat the competition.
Future supply chains need to cope with the long-term trends of mass customisation, ever shorter life cycles and the more recent volatile conditions that are here to stay. In these market conditions, many companies will benefit from a “smart” supply chain, which combines the drive to eliminate waste (i.e. anything that doesn’t add value) with agility and responsiveness (i.e. the ability to handle unpredictability with speed and flexibility).
A smart supply chain enables fast, flexible supply of tailor-made products at competitive cost levels. It excels in having few product and process quality issues, reduced operational costs, increased flexibility, and high internal process speeds. It integrates customers and business partners to create value in both the primary and support processes.
Building a smart supply chain requires a holistic approach that integrates product and process design, organisation design, and digital solutions:
an unambiguous supply chain strategy
product configuration for late postponement
processes that are aligned with strategy and designed for minimal order cycle times
a flat organisation with multidisciplinary teams and no silos
integration with partners throughout the supply chain
an aligned performance management system with real-time information from the end-to-end process
supply chain visibility with the ability for stakeholders throughout the supply chain to access real-time data related to the order process, planning, inventory, delivery and potential supply chain disruptions
Disciplined cash and working capital management drives good operational and financial performance. However, performance in order to cash, inventory management and procure to pay slumped over the 5 years prior to the COVID outbreak. A closer analysis reveals that inventory optimisation poses companies the biggest challenge – both in volatile and non-volatile markets. More Cash – Lower Inventory – Better Service, good inventory management is the key.
DELIVER DOUBLE DIGIT INVENTORY REDUCTIONS AND MAINTAIN OR IMPROVE SERVICE LEVELS
Decades of experience have taught us that going straight for the inventories themselves is both the quickest and the surest way of delivering a high-performing supply chain. Inventory sits right at the heart of your supply chain and is both a symptom and cause of your supply chain performance. Getting inventory right keeps your customers happy, increases flow and reduces cost and waste and frees up cash.
At Axisto, we combine the practical business focus of management consulting with the high-speed analytical capability of advanced information technology. We rapidly distil practical insights from data in Enterprise Resource Planning (ERP) systems. Our people concentrate on the human challenges of implementing and sustaining resilient and lean supply chains.
Our unique approach to supply chain puts inventory optimisation front and centre. This allows us to help deliver double digit reductions in inventory while maintaining or improving service levels – at speed in a low risk manner compared to traditional approaches.
OUR INVENTORY MANAGEMENT PROPOSITIONS
Axisto provides three inventory management propositions: inventory optimisation programmes, inventory analytics and inventory maturity assessments.
Our starting point with most clients is a quick scan. On the basis of just 3 standard reports from your ERP system, we quantify improvement potential item by item as well as overall. The output is both an immediate high-level quantification of improvement potential and the basis of a road map to deliver sustainable improvements quickly.
INVENTORY OPTIMISATION PROGRAMMES
We provide expert analytics and effective change management backed up by a clearly measurable business case. Improvements to inventory positions of 20% or more, sometimes much more, are usually achievable within the first year, at a high return on investment.
INVENTORY ANALYTICS
Do you find it difficult to really understand what your inventory data is telling you, or what you should do about it? Do you have optimisation tools that are difficult to use or which give results you know to be wrong, but you’re not sure why? With the proprietary technology that we use, we provide clients with rapid actionable insights into their inventory data.
In addition, we help clients with a range of targeted analytical exercises, ranging from strategic inventory positioning (where in your supply chain should you hold inventory?) through to setting inventory policies for items that are hard to optimise, such as spare parts, or make to order products.
INVENTORY MATURITY ASSESSMENTS
Inventory is influenced by almost every aspect of your business. Therefore, it can be hard to know at an enterprise level where the biggest opportunities for further improvement are, or how you compare to your competitors.
Axisto can take the temperature of your inventory management. We combine a granular, bottom-up quantitative assessment of your potential for improvement with a qualitative overview of your people, processes and systems, including relevant benchmarks, to give you actionable insights into where to find the next step change in your performance journey.
A CASE
CHALLENGE
A medium-sized industrial manufacturing firm with a strong market position and profitability had little historical focus on inventory. The consequence was that inventory was increasing gradually. It was time to act.
RESULTS
Inventory was reduced by more than 50% from the initial baseline over a period of 3 years, while service levels were maintained or improved. Improvements in the underlying data led to a better understanding of how and why to act – inventory management capability was significantly developed within the client’s teams.
SOME QUOTES
“We finally have full transparency of what we have, so we can make fact-based decisions on a weekly basis.” – Automotive manufacturer
“Since starting a programme, we have reduced our inventories by over 50%.” – Industrial manufacturer
“The results are exceptional and have made a major difference to our cash flow.” – Global manufacturing company
“The inventory programme brought a wide range of process issues into sharp focus, with an impact much broader than just inventory.” – Market-leading manufacturer
Digital transformation programmes, a new strategy, performance improvement programmes are all notoriously difficult to implement successfully. The vast majority change initiatives struggle to achieve and maintain the planned programme goals. In fact, only 30% are successful. Timely and complete delivery of a critical initiative is therefore the true determinant of competitive advantage for any company.
The vast majority of change initiatives stumble over the very thing they are trying to transform: the attitudes and behaviours of people at all levels of the organisation. Our Change Insider® (CI) measures people’s attitudes and behaviours towards the initiative and how they experience it. Based on these insights, the CI facilitates concrete strategic and tactical actions you need to take to make sure your change initiative is delivered successfully: on time, in full and in a sustainable manner.
HOW THE CHANGE INSIDER® ENSURES SUCCESS
The CI measures people’s perception of an initiative and how they experience it. This is done by asking a number of custom-designed questions as part of a short online survey that takes about 6 minutes to complete. The questions are created by collaborating with people from a cross-section of your organisation and cover the context, objectives, content and approach of your specific initiative. Therefore, the questions are tailored to your organisation and your change initiative. These are the crucial questions that live in your organisation about this specific initiative.
Everyone within the scope of the initiative answers these crucial questions. They do this in a confidential manner and can also add further comments. The survey results are then presented in practical, actionable reports for every relevant cross-section of your organisation.
The reports allow you to compare business units, departments, teams and levels in the organisation. You can see how your people are experiencing the initiative and how the chosen approach influences both the adoption of the change and the actual change itself. The feedback also highlights any differences between different levels or parts of the organisation. Therefore, you can carry out differentiated interventions and keep the entire initiative on track. The survey is repeated at fixed intervals. This way, the CI tracks the effect of interventions on the adoption of change, the actual change itself and the perception of the initiative over time. This provides information about what needs to be done when and where in the organisation to achieve the desired progress and sustainability of the change (see Figure 1).
Figure 1. An example from an CI report that demonstrates how people are experiencing the initiative by showing the development of answers to critical questions over two survey cycles.
The goal of the Change Insider® is very different to employee engagement surveys. The CI focuses on bringing about sustainable change with a specific initiative. Employee engagement surveys measure how dedicated employees are to their workplace or their employer.
THE DYNAMICS OF CHANGE
People’s ability to change their attitudes and behaviours is determined mainly by their perceptions and intentions. So we must first change perceptions and intentions before any change in attitudes and behaviours occurs. But how do we do this? The best way to influence people’s perceptions and intentions is to provide information and encourage people to gain new experiences.
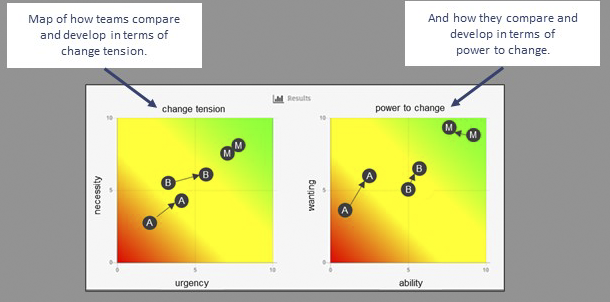
Perceptions and intentions record people’s motivations and are indicators of how hard people are willing to try or how much effort they intend to put in to display the required behaviour. During a change process, people are confronted with two forces: first, a change tension (the perceived need and urgency of the initiative) and, second, the power to change (the willingness to support and adopt the change and the ability to contribute). Both forces are needed in a programme to bring about change.
The way people experience these forces is the most important indicator of people’s perceptions and intentions towards an initiative. The rating for these two indicators gives the best prediction about a person’s intention to adopt the attitude and behaviour that is required. In different parts and levels of the organisation, the two forces are likely to develop differently, as shown in Figure 2. This drives the need for specific interventions for different parts of the organisation.
Figure 2. An example from an CI report showing the survey results of three teams (A, B, M) and the development of the effects of interventions over two survey cycles. The teams and their development can easily be compared.
The Change Insider® provides fact-based guidance for precisely these differentiated interventions to enable the timely and complete delivery of your mission-critical initiative.

 Instead of working with the designed process flow or the process flow that is depicted in the ERP system, process mining monitors the actual process at whatever granularity you want: end-2-end process, procure-2-pay, manufacturing, inventory management, accounts payable, for a specific type of product, supplier, customer, individual order, individual SKU. Process mining monitors compliance, conformance, cooperation between departments or between client, own departments and suppliers, etc.


.")
.")