Our More Optimal Platform provides companies with solutions to model, plan and optimise their business operations from end to end. Our platform can handle scenarios that are considered too complex for other software solutions: planning and optimising complex production value networks, optimising intricate logistics operations, and planning and scheduling highly diverse workforces.
Key capabilities include predictive and prescriptive data analytics, forecasting, what-if scenario planning, collaborative decision-making, disruption handling and production scheduling.
The platform is hosted in the cloud and no separate tooling is required. You can model supply chain applications in your browser where end-users use it as well – what you see is what you get!
Supply chain modelling requires no code or specific calculations, and visualisation can be created using a small amount of easily understood code.
Powerful algorithmic building blocks for optimisation come out of the box and are fully integrated in the platform.
Serverless scaling enables multiple algorithms to be run in parallel so that large supply chain conundrums can be tackled.
Maps, 3D visuals, Gantt charts and other charts come out of the box and can easily be configured by the modeler. Custom visuals can be created using low-code and may be shared with other modelers in the More Optimal community.
The calculation engine makes sure you can focus on what needs to be calculated; dependencies between calculated fields are automatically handled by the platform.
Your operating result is determined by the “behaviour” of your business processes. Why is the order cycle time for order A so much shorter than that for B? Where are the bottlenecks in my processes? Where does rework occur and what does it look like? What can I do to speed up my cash conversion cycle? And what about compliance?
Axisto answers these and many other questions with the help of process mining. Process mining is a data-driven analysis technique that shows actual process behaviour. We use this technique as an analysis tool for process and performance improvement. And it can either be applied for internal/external audits or be integrated into day-to-day operations to increase insight and support decision-making. Axisto guides you through the maze of different process mining tools, helps you tailor-make a solution that is right for you, and supports you towards a successful implementation.
These days, customers expect shorter fulfilment timeframes and have a lower tolerance for late or incomplete deliveries. At the same time, supply chain leaders face growing costs and volatility. how process mining creates value in the supply chain is by creating transparency and visibility across the supply chain and providing proposals for decisions with their trade-offs for real-time optimisation of flows.
FULL TRANSPARENCY
Instead of working with the designed process flow or the process flow that is depicted in the ERP system, process mining monitors the actual process at whatever granularity you want: end-2-end process, procure-2-pay, manufacturing, inventory management, accounts payable, for a specific type of product, supplier, customer, individual order, individual SKU. Process mining monitors compliance, conformance, cooperation between departments or between client, own departments and suppliers, etc.
VISIBILITY ACROSS THE SUPPLY CHAIN
Dashboards are created to suit your requirements. These are flexible and can be easily altered whenever your needs change and/or bottlenecks shift. They create real-time insights into the process flow. At any time, you know, how much revenue is at stake because of inventory issues, what root-causes are and which decisions you can take and what their effects and trade-offs will be.
If supplier reliability is not at the target level at the highest reporting level, you can easily drill down in real-time to a specific supplier and a particular SKU to discover what is causing the problem in real-time. Suppliers could also be held to the best-practice service level of competitive suppliers.
MAKING INFORMED DECISIONS AND TAKING THE RIGHT ACTIONS
The interactive reports highlight gaps between actual and target values and give details of the discrepancies, figure A. By clicking on one of the highlighted issues, you can assign an appropriate action to a specific person, figure B. Or it can even be done automatically when a discrepancy is detected.And direct communication with respect to the action is facilitated in real-time, figure C.
Fig. A, details of the discrepancies. Fig. B, pop up to write a task. Fig. C, exchanging information.
HOW PROCESS MINING CREATES VALUE IN THE SUPPLY CHAIN – WRAP UP
Process mining is an effective tool to optimise the end-2-end supply chain flows in terms of margin, working capital, inventory level and profile, cash, order cycle times, supplier reliability, customer service levels, sustainability, risk, predictability, etc. Because process mining monitors the actual process flows in real-time, it creates full transparency and therefore adds significant value to the classic BI-suites. Process mining can be integrated with existing BI-applications and can enhance reporting and decision-making. We consider process mining to be a core element of Industry 4.0.
THIS INTERVIEW WAS PUBLISHED BY THE GUARDIAN
Zoë Corbyn
Sun 6 Jun 2021 09.00 BST
‘AI systems are empowering already powerful institutions – corporations, militaries and police’: Kate Crawford. Photograph: Stephen Oxenbury
The AI researcher on how natural resources and human labour drive machine learning and the regressive stereotypes that are baked into its algorithms
Kate Crawford studies the social and political implications of artificial intelligence. She is a research professor of communication and science and technology studies at the University of Southern California and a senior principal researcher at Microsoft Research. Her new book, Atlas of AI, looks at what it takes to make AI and what’s at stake as it reshapes our world.
You’ve written a book critical of AI but you work for a company that is among the leaders in its deployment. How do you square that circle? I work in the research wing of Microsoft, which is a distinct organisation, separate from product development. Unusually, over its 30-year history, it has hired social scientists to look critically at how technologies are being built. Being on the inside, we are often able to see downsides early before systems are widely deployed. My book did not go through any pre-publication review – Microsoft Research does not require that – and my lab leaders support asking hard questions, even if the answers involve a critical assessment of current technological practices.
What’s the aim of the book? We are commonly presented with this vision of AI that is abstract and immaterial. I wanted to show how AI is made in a wider sense – its natural resource costs, its labour processes, and its classificatory logics. To observe that in action I went to locations including mines to see the extraction necessary from the Earth’s crust and an Amazon fulfilment centre to see the physical and psychological toll on workers of being under an algorithmic management system. My hope is that, by showing how AI systems work – by laying bare the structures of production and the material realities – we will have a more accurate account of the impacts, and it will invite more people into the conversation. These systems are being rolled out across a multitude of sectors without strong regulation, consent or democratic debate.
What should people know about how AI products are made? We aren’t used to thinking about these systems in terms of the environmental costs. But saying, “Hey, Alexa, order me some toilet rolls,” invokes into being this chain of extraction, which goes all around the planet… We’ve got a long way to go before this is green technology. Also, systems might seem automated but when we pull away the curtain we see large amounts of low paid labour, everything from crowd work categorising data to the never-ending toil of shuffling Amazon boxes. AI is neither artificial nor intelligent. It is made from natural resources and it is people who are performing the tasks to make the systems appear autonomous.
Unfortunately the politics of classification has become baked into the substrates of AI
Problems of bias have been well documented in AI technology. Can more data solve that? Bias is too narrow a term for the sorts of problems we’re talking about. Time and again, we see these systems producing errors – women offered less credit by credit-worthiness algorithms, black faces mislabelled – and the response has been: “We just need more data.” But I’ve tried to look at these deeper logics of classification and you start to see forms of discrimination, not just when systems are applied, but in how they are built and trained to see the world. Training datasets used for machine learning software thatcasually categorise people into just one of two genders; that label people according to their skin colour into one of five racial categories, and which attempt, based on how people look, to assign moral or ethical character. The idea that you can make these determinations based on appearance has a dark past and unfortunately the politics of classification has become baked into the substrates of AI.
You single out ImageNet, a large, publicly available training dataset for object recognition… Consisting of around 14m images in more than 20,000 categories, ImageNet is one of the most significant training datasets in the history of machine learning. It is used to test the efficiency of object recognition algorithms. It was launched in 2009 by a set of Stanford researchers who scraped enormous amounts of images from the web and had crowd workers label them according to the nouns from WordNet, a lexical database that was created in the 1980s.
Beginning in 2017, I did a project with artist Trevor Paglen to look at how people were being labelled. We found horrifying classificatory terms that were misogynist, racist, ableist, and judgmental in the extreme. Pictures of people were being matched to words like kleptomaniac, alcoholic, bad person, closet queen, call girl, slut, drug addict and far more I cannot say here. ImageNet has now removed many of the obviously problematic people categories – certainly an improvement – however, the problem persists because these training sets still circulate on torrent sites .
And we could only study ImageNet because it is public. There are huge training datasets held by tech companies that are completely secret. They have pillaged images we have uploaded to photo-sharing services and social media platforms and turned them into private systems.
You debunk the use of AI for emotion recognition but you work for a company that sells AI emotion recognition technology. Should AI be used for emotion detection? The idea that you can see from somebody’s face what they are feeling is deeply flawed. I don’t think that’s possible. I have argued that it is one of the most urgently needed domains for regulation. Most emotion recognition systems today are based on a line of thinking in psychology developed in the 1970s – most notably by Paul Ekman – that says there are six universal emotions that we all show in our faces that can be read using the right techniques. But from the beginning there was pushback and more recent work shows there is no reliable correlation between expressions on the face and what we are actually feeling. And yet we have tech companies saying emotions can be extracted simply by looking at video of people’s faces. We’re even seeing it built into car software systems.
What do you mean when you say we need to focus less on the ethics of AI and more on power? Ethics are necessary, but not sufficient. More helpful are questions such as, who benefits and who is harmed by this AI system? And does it put power in the hands of the already powerful? What we see time and again, from facial recognition to tracking and surveillance in workplaces, is these systems are empowering already powerful institutions – corporations, militaries and police.
What’s needed to make things better? Much stronger regulatory regimes and greater rigour and responsibility around how training datasets are constructed. We also need different voices in these debates – including people who are seeing and living with the downsides of these systems. And we need a renewed politics of refusal that challenges the narrative that just because a technology can be built it should be deployed.
Any optimism? Things are afoot that give me hope. This April, the EU produced the first draft omnibus regulations for AI. Australia has also just released new guidelines for regulating AI. There are holes that need to be patched – but we are now starting to realise that these tools need much stronger guardrails. And giving me as much optimism as the progress on regulation is the work of activists agitating for change.
The AI ethics researcher Timnit Gebru was forced out of Google late last year after executives criticised her research. What’s the future for industry-led critique? Google’s treatment of Timnit has sent shockwaves through both industry and academic circles. The good news is that we haven’t seen silence; instead, Timnit and other powerful voices have continued to speak out and push for a more just approach to designing and deploying technical systems. One key element is to ensure researchers within industry can publish without corporate interference, and to foster the same academic freedom that universities seek to provide.
Atlas of AI by Kate Crawford is published by Yale University Press (£20). To support the Guardian order your copy at guardianbookshop.com. Delivery charges may apply.
Are your business processes still up to the required standard?
Particularly now, in the major economic recession that has set in due to the Corona lockdowns, the quality of your business processes have to be top notch. After all, this is the determiner of the operational performance your company delivers.
Over the years your customer base will have changed, but so too has your supplier base, your products and services, your employees, your IT-infrastructure and your organisational structure. With every change your processes have been affected and now they are rather a tangled web with insufficient performance.
Understanding how your processes behave – a prerequisite for improvement
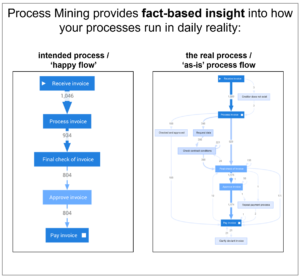
The scale of the current crisis requires companies to move quickly. You want to cut costs, slash cycle time, serve customers faster, get things right first time, improve reliability and be more agile. Therefore, you need a 100% fact-based insight into how your business processes are currently performing – and this can only be obtained through Process Mining.
Process Mining – the gateway to rapid operational performance improvement
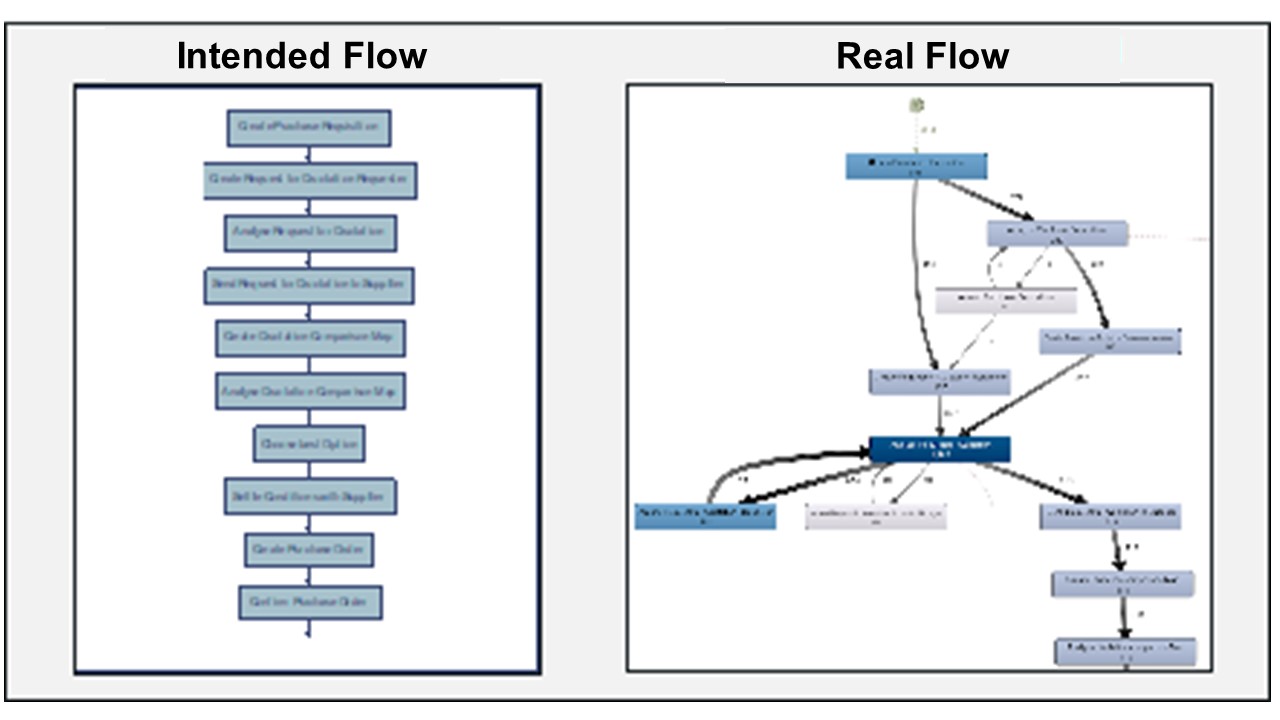
How business processes behave is determined by the way those processes are designed and represented in IT-systems on the one hand and how your employees behave on the other. The good news is that this information is already captured in the log data in your IT-systems. This log data can be loaded from your IT-systems into the Process Mining software tool and, literally at the touch of a button, it then displays your process, as it behaves in daily reality, with all the process variants, rework loops, bottlenecks, compliance issues and more. Static, as a process flow, and dynamic, in the form of an animation. In short, a fast and effective way to understand processes and make an effective impact on those things that really matter.
The power of Process Mining
Process Mining (PM) quickly puts an end to “underbelly” discussions because it is fact-based. With PM, both the entire process and an individual case can be analysed – and everything in between. After loading your log data into PM, interactive “deep dives” can be organised with the people involved in the process. Our experience is that the root cause of problems is discovered in a short time and it quickly becomes clear which actions need to be taken to solve problems and seize opportunities.
CHALLENGE
A large global manufacturing company had over the years experienced a decline in performance at one of its sites – in production reliability, technical integrity of the equipment, efficiency and morale.
The site had recently made some improvements, but top management wanted things to change at a much faster rate. Because of its reputation to deliver fast and sustainable operational performance improvements, Axisto was invited on site to support the turnaround.
APPROACH
Our first task was to conduct a series of interviews with a cross-section of the organisation to get an initial feel for the culture and an insight into the issues the business faced. We found a lack of definition around the business processes and insufficient clarity of roles and responsibilities. As a consequence, performance management was inadequate.
Axisto and the client team worked together, first to develop a compelling vision, and then to create a well-aligned operating model with clear process flows, key performance indicators, roles and responsibilities, and an appropriate meeting and reporting structure.
By concurrently designing and implementing the improved operating model, things started to improve rapidly. People now had more clarity on what was expected from them – and also what they could expect from others. Quite quickly more effective behaviours started to develop, and with these came the desired improvements in operational performance.
Steering the company in volatile times
The coronavirus pandemic has caused a swell across business markets, in terms of both volatility and financial risk. To sail the company ship through these rough economic seas, your compass needs to be accurate and the quality of decisions and actions taken must be right. All crew members need the appropriate information to make the right decisions and act accordingly. Unfortunately, this is seldom the case. More often than not the crew sails blindfolded, unable to act effectively; the company drifts off course and targets are not met.
The Performance Management System
This is where the Performance Management System (PMS) comes in. In Part 1 we focused on an appealing vision and ambition – the dot on the horizon to sail to. In Part 2 we considered how to align the cost structure with this vision. In Part 3 we deployed the vision and ambition through all organisational levels and made sure that everyone in the company was aligned and owned the targets. In Part 4 we looked at how to design the key business processes. The PMS ties all of this together.
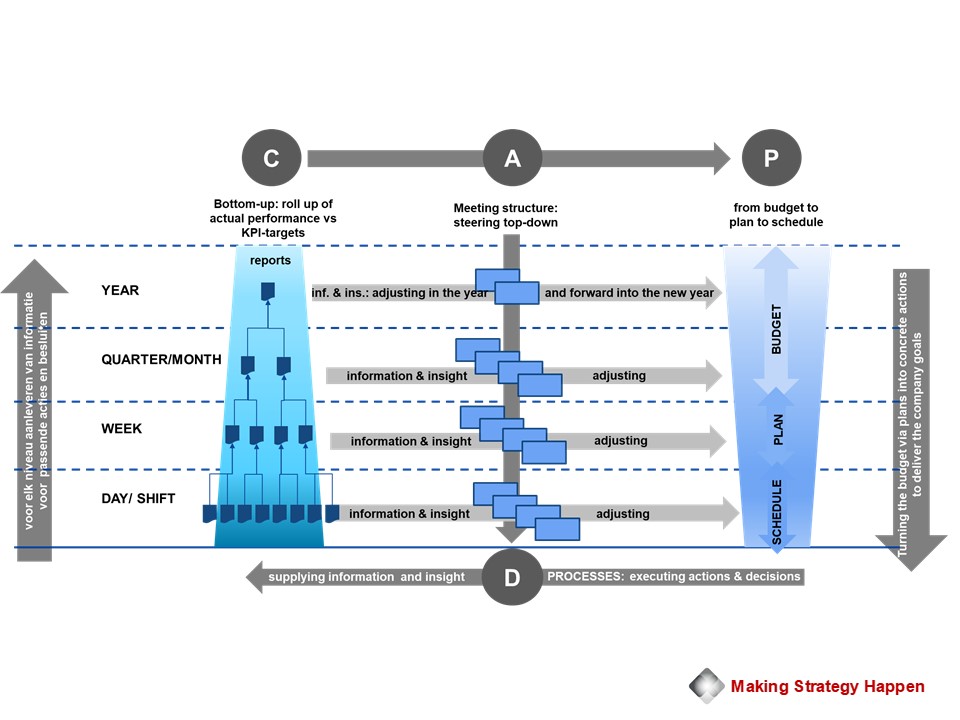
The PMS is like the control panel in the bridge of a ship. In fact, it is a set of fast and slow Plan-Do-Check-Act cycles. PDCA – the good old Deming cycle. The basic principle is shown below.
On the right is the “P” column: turning the annual budget into a daily activity schedule. The lower horizontal part is the “D” area: the actual business processes where activities are done. On the left is the “C” column: reporting actual performance against the targets. In the middle is the “A” column: the daily, weekly, monthly, quarterly and annual meetings in which actions are formulated and decisions taken to drive actual performance to KPI targets based on the information and insights supplied through the reports. The fast cycles occur shift-to-shift, day-to-day and week-to-week. Above that the slower cycles are active.
It is important to ensure that the PDCA cycles are closed and that the faster and slower ones work in synch. Closed PDCA cycles drive actual performance to KPI targets.
Purpose of the Performance Management System
The purpose of the Performance Management System is to (1) manage the organisation and the business processes to ensure delivery of the company goals, (2) support the development and continuity of effective behaviour of people at all levels in the organisation, and (3) facilitate people to work as “one team – one goal”.
In November 2020, McKinsey published an interesting paper entitled “Value creation in industrials”, a survey of the US industrials sector. The purpose of the analysis was to gain insight into the factors that determine performance in the industrials sector. Value creation was used as an indicator, measured as annual growth of the total shareholder return (TSR). The research covers the period 2014–2019. So, what are the conclusions on how to create value in Industrials?
CONCLUSIONS
The industrials sector is broad and diverse. In order to compare companies in a meaningful way, McKinsey divided the sector into 90 so-called microverticals. More on that later.
The main conclusions about how to create value in Industrials:
Even in good times, TSR performance across and within microverticals is highly variable.
Despite the tailwind or headwind, companies ultimately determine their own destiny.
The TSR performance gap between the best-performing and worst-performing companies within a microvertical is substantial and growing.
Companies with strong balance sheets for 2019 have, on average, outperformed their competitors: the COVID-19 pandemic has widened the gap between the best and worst performers.
Operational performance, and in particular margin improvement, is by far the most important factor in value creation.
HOW CAN WE COMPARE COMPANIES IN SUCH A DIVERSE INDUSTRIAL SECTOR?
While the manufacturing sector performed well at an annual growth rate of 11 per cent between 2014 and 2019, performance varied widely between the ten subsectors. Now the diversity between and within the subsectors is very great. In order to properly identify the factors that determine the performance, the study worked with 90 groups of companies that carry similar products and that focus on a similar end market: the so-called microverticals.
WHICH TRENDS ARE AFFECTING THE MICROVERTICALS?
Five categories emerge from the research: (1) regulation, (2) consumer and socio-economic, (3) technological, (4) environment, and (5) industrial structure and movements of players in the market. Any one of these trends can cause a tailwind or headwind – often both. Measured in revenue and margin growth, these trends predominantly work out well for the top-performing microverticals and negatively for some of the bottom microverticals.
COMPARING MICROVERTICALS AND COMPANIES WITHIN THEM.
First of all, the fact that the company is in a top-performing microvertical is no guarantee that it is a top performer. It can also be seen that the best-performing companies within a microvertical perform substantially better than the worst-performing companies within the same microvertical. The performance gap is substantial and growing.
McKinsey found a 2,600 base point difference in TSR between the best- and worst-performing microverticals. Approximately 30 per cent of companies performed significantly better or worse than what the performance of their microverticals would have predicted. So success depends not only on whether you are in the “right” microvertical; a company’s actions are also important. Individual companies can do a lot to determine their fate, even when headwinds and tailwinds affect microvertical performance. Furthermore, the survey found that, on average, companies with strong balance sheets for 2019 outperformed their competitors, meaning the COVID-19 pandemic has widened the gap between the best and worst performers.
WHAT CAN WE LEARN FROM THE BEST COMPANIES?
To determine which actions matter at a company level, the TSR performance of individual companies was analysed. To this end, the TSR was divided into three broad elements:
1. Operational performance
This element refers to how a company uses its capital to increase revenues and operating margins; this category also includes a company’s ability to generate value for its shareholders in a scenario with no growth and unchanged profitability. The latter is a measure of the starting position of a company.
2. Leverage
Leverage refers to how companies use debt to improve their TSR performance.
3. Multiple expansion
This element refers to opportunities to take advantage of changes in how investors see the future.
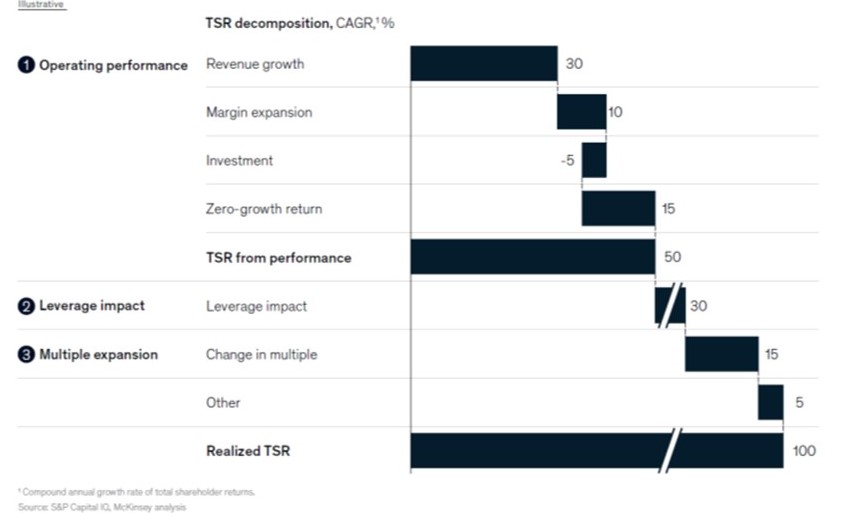
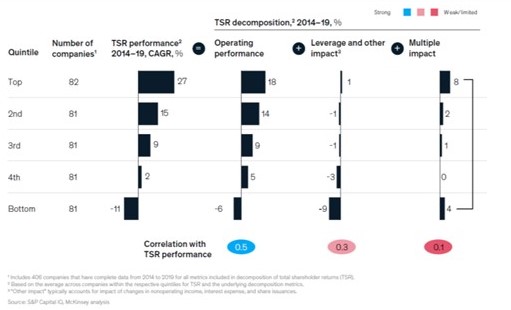
Figure 1 provides insight into the way in which companies secured their position.
Figure 1. The way in which companies secured their position.
Of the three elements of TSR, operational performance was found to be the strongest predictor of TSR CAGR from 2014 to 2019 for all quintiles (Figure 2). Operational performance had the highest correlation coefficient with TSR performance, at 50 per cent, followed by leverage (about 30 per cent) and multiple expansion (about 10 per cent).
At the top-performing companies, operating performance contributed to 18 percentage points of the 27 per cent TSR growth. And for the worst performing companies −6 percentage points of −11 per cent TSR growth.
Figure 2. Operating performance had the strongest correlation with the company TSR.
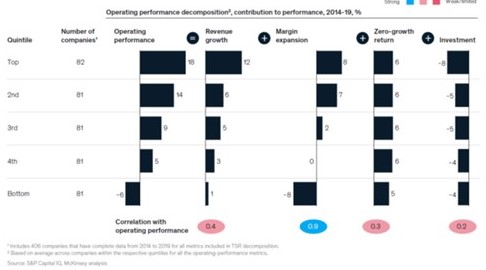
Within the operational measures, margin expansion was a major contributing factor and also the strongest determinant of the company’s TSR performance (Figure 3). With a 90 per cent correlation to business performance, the profitability extension (margin) adds an average of 8 percentage points to the 18 per cent operational performance of the top performing companies and takes 8 percentage points away from the lowest quintile companies, where the business performance is on average −6 percent.
Figure 3. From the operational statistics, margin expansion proved (often made possible by technology) the main determining factor for the company’s TSR.
Looking at the top-performing companies, it turned out that their success had depended mainly on taking three steps:
HOW DO YOU ENABLE SUCCESS AND HOW DO YOU MAINTAIN IT?
To further increase the likelihood of continued success, companies need good supervision. Executives must balance their time between creating and executing strategies, and periodically reassessing and rebalancing the business portfolio. Along the way, they should look for ways to improve earning power through rapid (two-year) cycles of margin transformation, leveraging technology wherever possible.
Industry 4.0 is in the spotlight. And rightly so. The possibilities are great: higher productivity, a better customer experience, lower costs and perhaps a new business strategy with innovative products and services. And there is an outright need: without Industry 4.0 a company has a limited future. Unfortunately, many Industry 4.0 implementations get stuck. Let’s find out why this happens and how to prevent it happening to you.
DATA
There can be three issues with data: not good, not available, poor quality. This is often due to IT systems not being set up properly, data not being entered or being entered incorrectly, log switches to register log data not being set correctly, or the data entered being of poor quality.
In addition, the knowledge of business processes is seldom up to standard. How do processes behave in daily practice? How should they run? This means that people are unclear as to which data should be captured and how the data should be managed.
It is therefore important to know the business processes and how they work both in theory and in practice. This is the basis for a good KPI and reporting structure. Getting this right will ensure clarity around which data must be collected, which information is required for whom at what time and how to manage the processes for maximum effect. It will also mean that data availability and quality will increase – thus building the foundation for Industry 4.0.
ORGANISATIONAL SILOS
Many companies still have a strong departmental orientation instead of an end-to-end process focus. This leads to limited insight into and understanding of the interdependencies between functions and departments. A strong departmental orientation also means that data is locked up in silos.
Industry 4.0 focuses on the integrated control of the end-to-end processes that run through various departments and even across company boundaries. That is why departments are asked to work together seamlessly and to share data and information. An effective IT infrastructure facilitates this.
CAPABILITIES TO COLLECT AND USE DATA
The introduction of Industry 4.0 requires a significantly higher level of knowledge of the
industry, of business processes and of analysis applications. At every level in the company and within every position, people must be able to handle data well and be skilled in its analysis.
The technical structure of these cyber-physical systems is becoming more complex, and more and more decisions are being made by algorithms. Therefore, it is important that companies develop the knowledge and skills to build applications and assess the behaviour of algorithms and the insights they provide. The introduction of Industry 4.0 requires intensive collaboration between departments and disciplines to develop people and resources at pace.
VISION AND ORGANISATIONAL ALIGNMENT
The introduction of Industry 4.0 affects all aspects of an operating model. The top team needs a shared vision about the value that is required for various stakeholders, and how that value is delivered – the operating model.
Too often, a joint vision is ill-considered and not adequately thought through, resulting in insufficient alignment with the roadmap. In such a situation, an implementation inevitably comes to a standstill.
THE HUMAN FACTOR
The biggest challenge in an Industry 4.0 implementation is not so much choosing the right technology, but dealing with the absence of a data-based and digital performance culture and the corresponding skills gap in the organisation. Investing in the right technologies is important – but success or failure ultimately does not depend on specific sensors, algorithms or analysis programs. The crux lies in a wide range of people-oriented factors.
Since Industry 4.0 transcends not only internal departments but also the boundaries of the company, its success is predominantly dependent on skillful change management.
CONCLUSION
In essence, the reasons why Industry 4.0 implementations get stuck are no different than with other company-wide transformations whose aim is to create a sustainably high-performing organisation. It will not surprise you that the chance of failure is roughly the same: 70%.
Therefore, in the first instance, do not focus too much on just the technical side of the transformation. Instead, concentrate on skilful change management. The technological content side of the transformation is not your main problem. The development of a data-based and digital performance culture and the corresponding skills set is.
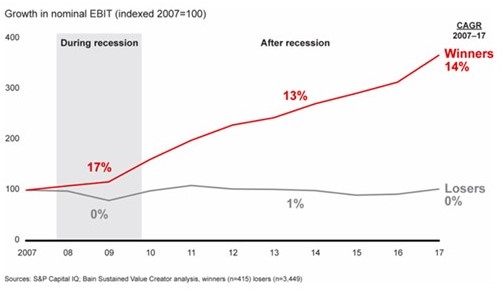
Inevitably, after every recession the economy grows again. Research by Bain & Company, Harvard Business Review, Deloitte, and McKinsey shows that the best companies continue to grow their EBIT during a recession and also accelerate faster after it when compared to other companies (see Figure 1). Let’s take a look at what the winners do differently to accelerate their profitability during and after a recession.
Figure 1. “Winning companies accelerated profitability during and after the recession, while losers stalled” (Source: Bain & Company).
7 KEY ACTIONS TO ACCELERATE YOUR PROFITABILITY DURING AND AFTER A RECESSION
We’ve integrated this research material to generate a clear picture of the 7 key actions you need to take for success.
1. CREATE CLARITY OF DIRECTION AND ORGANISATIONAL ALIGNMENT
How do you want your company to look and run in three to five years from now? And in one year? What are the vital few strategic initiatives to focus on? Make sure your leadership team is committed and fully aligned.
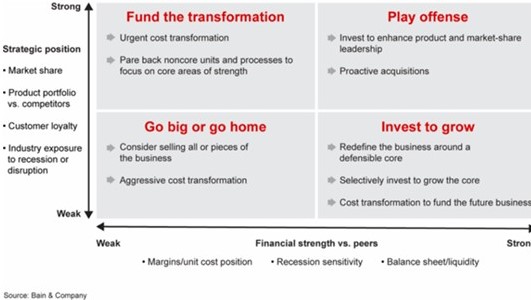
2. UNDERSTAND YOUR STRATEGIC AND FINANCIAL POSITION
Mapping out your plans depends on your strategic and financial position
(see Figure 2).
Figure 2. Mapping out your plans requires an assessment of your company’s strategic and financial position (Source: Bain & Company).
3. FREE UP “CURRENCY”
This is not about blunt cost cutting; the focus is on aligning your spending with your vision and strategic initiatives. Zero-based Alignment / Budgeting is a good way to select and make lean those activities that are fully aligned. The “currency” you free up can strengthen your balance sheet and support your investment agenda.
4. RETAIN YOUR CUSTOMERS
Retaining your customers is so much cheaper than acquiring new ones. The margin impact is significant. Explore ways to help your customers through the downturn and strengthen your relation with them. And be sure to focus on the right customers.
5. PLAN FOR VARIOUS SCENARIOS
Nobody knows when and how a downturn will unfold and when the economy will start to grow again. The winners have developed various scenarios, and they know how they should act in each scenario. This allows them to move quickly and decisively.
6. ACT QUICKLY AND DECISIVELY
Winning companies act quickly and decisively, both in the downturn and particularly in the early upturn when the opportunities start to arise. They have already created the “currency” to invest.
Not all companies have been equally aggressive in adopting new technologies. There are many opportunities here for improving efficiency or generating more value and thereby gaining a competitive advantage. The current COVID19 pandemic could well be an important catalyst.
This means that you have to be prepared for an economic downturn to come out as one of the winners. It should be noted that in these key actions, there is, in fact, no difference between being prepared for an economic downturn and running a business for continuous and maximum success. This picture is consistent with one that emerges from one of our other articles “How to create value in Industrials?”.