The coronavirus pandemic has caused a swell across business markets, in terms of both volatility and financial risk. To sail the company ship through these rough economic seas, your compass needs to be accurate and the quality of decisions and actions taken must be right. All crew members need the appropriate information to make the right decisions and act accordingly. Unfortunately, this is seldom the case. More often than not the crew sails blindfolded, unable to act effectively; the company drifts off course and targets are not met.
The Performance Management System
This is where the Performance Management System (PMS) comes in. In Part 1 we focused on an appealing vision and ambition – the dot on the horizon to sail to. In Part 2 we considered how to align the cost structure with this vision. In Part 3 we deployed the vision and ambition through all organisational levels and made sure that everyone in the company was aligned and owned the targets. In Part 4 we looked at how to design the key business processes. The PMS ties all of this together.
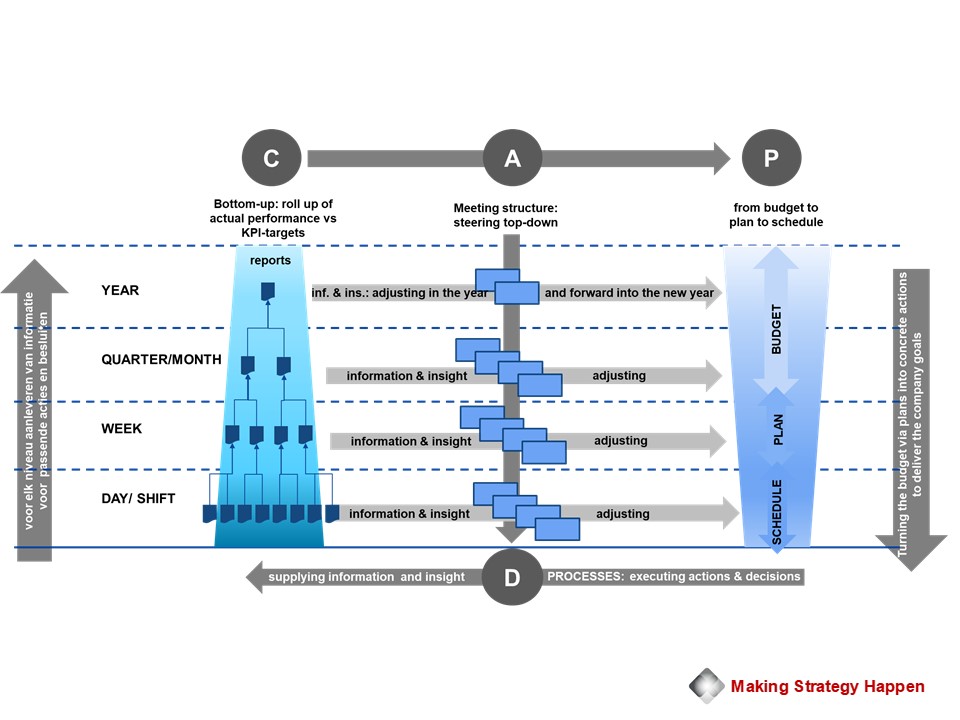
The PMS is like the control panel in the bridge of a ship. In fact, it is a set of fast and slow Plan-Do-Check-Act cycles. PDCA – the good old Deming cycle. The basic principle is shown below.
On the right is the “P” column: turning the annual budget into a daily activity schedule. The lower horizontal part is the “D” area: the actual business processes where activities are done. On the left is the “C” column: reporting actual performance against the targets. In the middle is the “A” column: the daily, weekly, monthly, quarterly and annual meetings in which actions are formulated and decisions taken to drive actual performance to KPI targets based on the information and insights supplied through the reports. The fast cycles occur shift-to-shift, day-to-day and week-to-week. Above that the slower cycles are active.
It is important to ensure that the PDCA cycles are closed and that the faster and slower ones work in synch. Closed PDCA cycles drive actual performance to KPI targets.
Purpose of the Performance Management System
The purpose of the Performance Management System is to (1) manage the organisation and the business processes to ensure delivery of the company goals, (2) support the development and continuity of effective behaviour of people at all levels in the organisation, and (3) facilitate people to work as “one team – one goal”.
WHY ORGANISATIONAL ALIGNMENT?
We live in a time of unprecedented change and uncertainty. For a company to be successful in this day and age, it must stay alert to changing situations and always be one step ahead of the market. This is only possible if departments are properly connected and able to move quickly with each other in the event of necessary short-term adjustments – and do so without losing sight of the longer-term aims.
In this respect it is comparable to a flock of starlings. They fly close together, all at the same speed. Each starling keeps an eye on up to seven of its neighbours and reacts very quickly should any of them change direction. This allows the swarm to move quickly without collision and change direction as a unit to avoid problems.
Their short-term changes in direction are not a sign of opportunistic behaviour; they could be a response to an attacking bird of prey. The ultimate goal is clear and will be achieved.
WHAT IS ORGANISATIONAL ALIGNMENT?
Organisational alignment means that vision, strategic goals, targets, the operating model, behaviour and skills of the people in the organisation are in line with each other. This is shown in the figure below.
HOW TO ACHIEVE ORGANISATIONAL ALIGNMENT?
COMPELLING VISION
Alignment starts with a compelling vision – one that connects, inspires and appeals to the different populations within the company. It is important that everyone in the organisation feels as if they own the vision.
This sense of ownership will not come about simply by organising a few sessions with the leadership team and company-wide communication. Instead, it is a journey that starts at the top, but then goes through all levels of the organisation. At the end of that journey is a vision that everyone has contributed to, recognises and wants to go for.
Incidentally, a vision is not static and will continue to evolve in line with developments in technology, the market, society, amongst other things. The people in the organisation do need sufficient stability. That is why an appealing vision consists of a fixed part that always remains and a variable part that always develops.
STRATEGIC GOALS
However appealing a vision is, it is relatively worthless if it does not translate into a set of strategic goals with targets (Key Performance Indicators, or KPIs) – not just at the top of the organisation, but at all levels including the shop floor.
This process of cascading goals and targets is a delicate one. The goals and targets at the top of the company must be achieved, while department heads and team leaders must accept their derived goals and targets. Good insight into the current performance, the formulation of SMART goals (Specific, Measurable, Achievable, Realistic and Time based) and a careful dialogue support the acceptance process. There must be strong ownership of the goals and targets for them to be realised.
ANCHORING IN THE DAILY RUNNING OF THE BUSINESS
Subsequently, the plans and targets are anchored in the day-to-day running of the organisation. This requires transparency of actual performance against the KPI targets as well as attitudes and behaviours that drive the actual performance towards the targets.
An operating model that is aligned with the vision and strategic goals provides this transparency and supports the development and maintenance of effective attitudes and behaviours.
ORGANISATIONAL ALIGNMENT – A KEY TO SUCCESS
If vision, strategic goals, targets, operating model, behaviour and skills of the people are aligned, the organisation can quickly and adequately navigate changing circumstances without losing sight of its longer-term goal and realise its ambition.
CHALLENGE
An electronic components manufacturer wanted to integrate two manufacturing sites, improve product quality and refocus the demand generation.
APPROACH
Four-week Analysis & Design to align the management teams of both sites, design a process and structure to manage the sites in an integrated way, understand how to tackle the product quality issues, design the steps to refocus the demand generation and design the change programme.
en-month programme to implement the new management process, structure and team. Improved product quality by applying 6-Sigma tools. Installed TPM and improved both maintenance productivity and equipment availability. Moved most of the quality assurance to the operators and took out related quality resources. Changed sales from product push to market pull and aligned the innovation portfolio.
In November 2020, McKinsey published an interesting paper entitled “Value creation in industrials”, a survey of the US industrials sector. The purpose of the analysis was to gain insight into the factors that determine performance in the industrials sector. Value creation was used as an indicator, measured as annual growth of the total shareholder return (TSR). The research covers the period 2014–2019. So, what are the conclusions on how to create value in Industrials?
CONCLUSIONS
The industrials sector is broad and diverse. In order to compare companies in a meaningful way, McKinsey divided the sector into 90 so-called microverticals. More on that later.
The main conclusions about how to create value in Industrials:
Even in good times, TSR performance across and within microverticals is highly variable.
Despite the tailwind or headwind, companies ultimately determine their own destiny.
The TSR performance gap between the best-performing and worst-performing companies within a microvertical is substantial and growing.
Companies with strong balance sheets for 2019 have, on average, outperformed their competitors: the COVID-19 pandemic has widened the gap between the best and worst performers.
Operational performance, and in particular margin improvement, is by far the most important factor in value creation.
HOW CAN WE COMPARE COMPANIES IN SUCH A DIVERSE INDUSTRIAL SECTOR?
While the manufacturing sector performed well at an annual growth rate of 11 per cent between 2014 and 2019, performance varied widely between the ten subsectors. Now the diversity between and within the subsectors is very great. In order to properly identify the factors that determine the performance, the study worked with 90 groups of companies that carry similar products and that focus on a similar end market: the so-called microverticals.
WHICH TRENDS ARE AFFECTING THE MICROVERTICALS?
Five categories emerge from the research: (1) regulation, (2) consumer and socio-economic, (3) technological, (4) environment, and (5) industrial structure and movements of players in the market. Any one of these trends can cause a tailwind or headwind – often both. Measured in revenue and margin growth, these trends predominantly work out well for the top-performing microverticals and negatively for some of the bottom microverticals.
COMPARING MICROVERTICALS AND COMPANIES WITHIN THEM.
First of all, the fact that the company is in a top-performing microvertical is no guarantee that it is a top performer. It can also be seen that the best-performing companies within a microvertical perform substantially better than the worst-performing companies within the same microvertical. The performance gap is substantial and growing.
McKinsey found a 2,600 base point difference in TSR between the best- and worst-performing microverticals. Approximately 30 per cent of companies performed significantly better or worse than what the performance of their microverticals would have predicted. So success depends not only on whether you are in the “right” microvertical; a company’s actions are also important. Individual companies can do a lot to determine their fate, even when headwinds and tailwinds affect microvertical performance. Furthermore, the survey found that, on average, companies with strong balance sheets for 2019 outperformed their competitors, meaning the COVID-19 pandemic has widened the gap between the best and worst performers.
WHAT CAN WE LEARN FROM THE BEST COMPANIES?
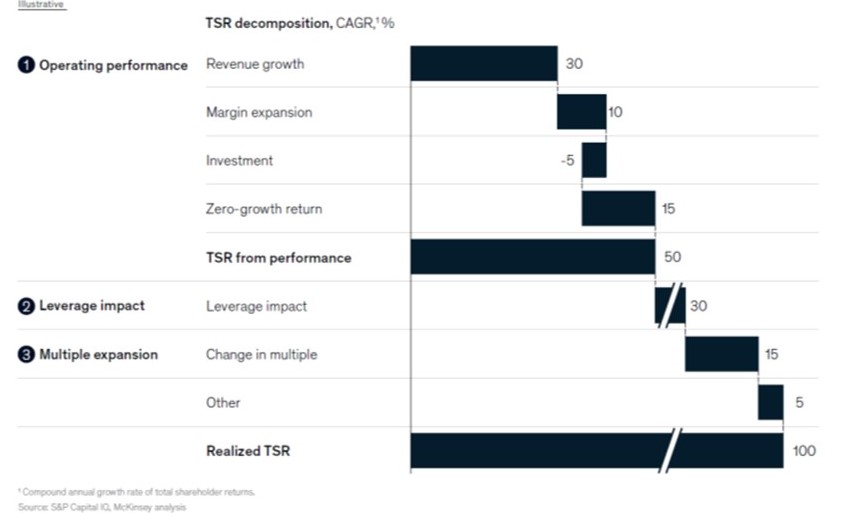
To determine which actions matter at a company level, the TSR performance of individual companies was analysed. To this end, the TSR was divided into three broad elements:
1. Operational performance
This element refers to how a company uses its capital to increase revenues and operating margins; this category also includes a company’s ability to generate value for its shareholders in a scenario with no growth and unchanged profitability. The latter is a measure of the starting position of a company.
2. Leverage
Leverage refers to how companies use debt to improve their TSR performance.
3. Multiple expansion
This element refers to opportunities to take advantage of changes in how investors see the future.
Figure 1 provides insight into the way in which companies secured their position.
Figure 1. The way in which companies secured their position.
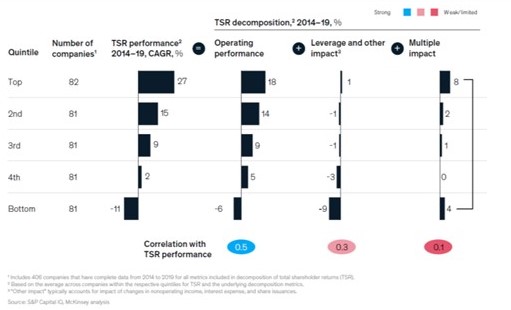
Of the three elements of TSR, operational performance was found to be the strongest predictor of TSR CAGR from 2014 to 2019 for all quintiles (Figure 2). Operational performance had the highest correlation coefficient with TSR performance, at 50 per cent, followed by leverage (about 30 per cent) and multiple expansion (about 10 per cent).
At the top-performing companies, operating performance contributed to 18 percentage points of the 27 per cent TSR growth. And for the worst performing companies −6 percentage points of −11 per cent TSR growth.
Figure 2. Operating performance had the strongest correlation with the company TSR.
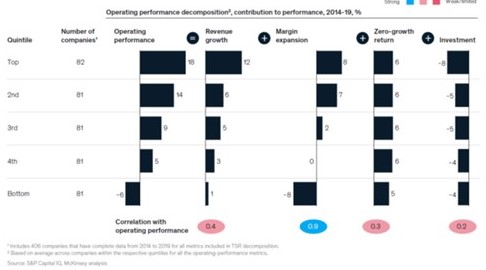
Within the operational measures, margin expansion was a major contributing factor and also the strongest determinant of the company’s TSR performance (Figure 3). With a 90 per cent correlation to business performance, the profitability extension (margin) adds an average of 8 percentage points to the 18 per cent operational performance of the top performing companies and takes 8 percentage points away from the lowest quintile companies, where the business performance is on average −6 percent.
Figure 3. From the operational statistics, margin expansion proved (often made possible by technology) the main determining factor for the company’s TSR.
Looking at the top-performing companies, it turned out that their success had depended mainly on taking three steps:
HOW DO YOU ENABLE SUCCESS AND HOW DO YOU MAINTAIN IT?
To further increase the likelihood of continued success, companies need good supervision. Executives must balance their time between creating and executing strategies, and periodically reassessing and rebalancing the business portfolio. Along the way, they should look for ways to improve earning power through rapid (two-year) cycles of margin transformation, leveraging technology wherever possible.
CHALLENGE
Our client, a global leader in the field of engineered capital goods for energy and telecoms, was facing a strongly increasing demand after an economic downturn and was struggling with production reliability at all stages of the production process.
The unreliability led to falling output, less time for equipment maintenance and delivery unreliability to their clients.
Therefore, the situation had to be brought under control quickly.
APPROACH
As each of the supervisors had a very different vision of what he was trying to achieve, our starting point was to create a detailed, tangible, operational vision of production: what it would look like, how it should be run.
Together we turned this in well-designed production management system, a set of improvement targets and an implementation plan. This approach generated a lot of energy and a strong desire for change.
During the implementation the atmosphere in the factory changed quickly from finger-pointing to a more contructive one of cooperation and joint responsibility. The plant’s performance stabilised and halfway into the project, the annual production output was ahead of budget and payroll costs were below target.
Industry 4.0 is in the spotlight. And rightly so. The possibilities are great: higher productivity, a better customer experience, lower costs and perhaps a new business strategy with innovative products and services. And there is an outright need: without Industry 4.0 a company has a limited future. Unfortunately, many Industry 4.0 implementations get stuck. Let’s find out why this happens and how to prevent it happening to you.
DATA
There can be three issues with data: not good, not available, poor quality. This is often due to IT systems not being set up properly, data not being entered or being entered incorrectly, log switches to register log data not being set correctly, or the data entered being of poor quality.
In addition, the knowledge of business processes is seldom up to standard. How do processes behave in daily practice? How should they run? This means that people are unclear as to which data should be captured and how the data should be managed.
It is therefore important to know the business processes and how they work both in theory and in practice. This is the basis for a good KPI and reporting structure. Getting this right will ensure clarity around which data must be collected, which information is required for whom at what time and how to manage the processes for maximum effect. It will also mean that data availability and quality will increase – thus building the foundation for Industry 4.0.
ORGANISATIONAL SILOS
Many companies still have a strong departmental orientation instead of an end-to-end process focus. This leads to limited insight into and understanding of the interdependencies between functions and departments. A strong departmental orientation also means that data is locked up in silos.
Industry 4.0 focuses on the integrated control of the end-to-end processes that run through various departments and even across company boundaries. That is why departments are asked to work together seamlessly and to share data and information. An effective IT infrastructure facilitates this.
CAPABILITIES TO COLLECT AND USE DATA
The introduction of Industry 4.0 requires a significantly higher level of knowledge of the
industry, of business processes and of analysis applications. At every level in the company and within every position, people must be able to handle data well and be skilled in its analysis.
The technical structure of these cyber-physical systems is becoming more complex, and more and more decisions are being made by algorithms. Therefore, it is important that companies develop the knowledge and skills to build applications and assess the behaviour of algorithms and the insights they provide. The introduction of Industry 4.0 requires intensive collaboration between departments and disciplines to develop people and resources at pace.
VISION AND ORGANISATIONAL ALIGNMENT
The introduction of Industry 4.0 affects all aspects of an operating model. The top team needs a shared vision about the value that is required for various stakeholders, and how that value is delivered – the operating model.
Too often, a joint vision is ill-considered and not adequately thought through, resulting in insufficient alignment with the roadmap. In such a situation, an implementation inevitably comes to a standstill.
THE HUMAN FACTOR
The biggest challenge in an Industry 4.0 implementation is not so much choosing the right technology, but dealing with the absence of a data-based and digital performance culture and the corresponding skills gap in the organisation. Investing in the right technologies is important – but success or failure ultimately does not depend on specific sensors, algorithms or analysis programs. The crux lies in a wide range of people-oriented factors.
Since Industry 4.0 transcends not only internal departments but also the boundaries of the company, its success is predominantly dependent on skillful change management.
CONCLUSION
In essence, the reasons why Industry 4.0 implementations get stuck are no different than with other company-wide transformations whose aim is to create a sustainably high-performing organisation. It will not surprise you that the chance of failure is roughly the same: 70%.
Therefore, in the first instance, do not focus too much on just the technical side of the transformation. Instead, concentrate on skilful change management. The technological content side of the transformation is not your main problem. The development of a data-based and digital performance culture and the corresponding skills set is.
CHALLENGE
Our client was a Europe-based company developing and manufacturing key electronic components for customers in the consumer electronics; based mainly in Asia.
They were in the ramp-up phase of a new product, and growth was explosive. However, they were suddenly confronted with catastrophic product failure affecting 40% – 60% of the production output.
APPROACH
With senior management we worked on strategic and operational alignment with global market conditions. Together with cross-functional / level teams, we set an aggressive 23-week action plan for bringing production under control.
In production, we focussed on solving the quality problems, increasing the availability of production equipment and improving delivery reliability.
Through collaboration and knowledge transfer, we ensured that employees were empowered and accountable for the delivery of their improvement areas. We helped them to apply the relevant tools they had been trained apply in a skilled manner.
Together with the teams we introduced a new Performance Management System to support their new ways of working. By involving employees in the design, they developed a strong co-ownership of the changes, their unit and its results.
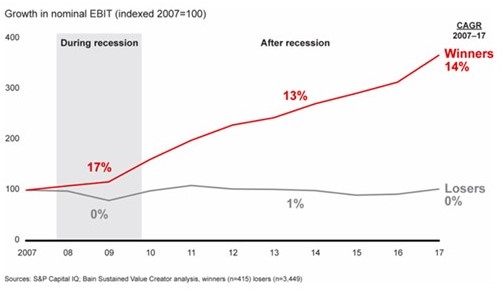
Inevitably, after every recession the economy grows again. Research by Bain & Company, Harvard Business Review, Deloitte, and McKinsey shows that the best companies continue to grow their EBIT during a recession and also accelerate faster after it when compared to other companies (see Figure 1). Let’s take a look at what the winners do differently to accelerate their profitability during and after a recession.
Figure 1. “Winning companies accelerated profitability during and after the recession, while losers stalled” (Source: Bain & Company).
7 KEY ACTIONS TO ACCELERATE YOUR PROFITABILITY DURING AND AFTER A RECESSION
We’ve integrated this research material to generate a clear picture of the 7 key actions you need to take for success.
1. CREATE CLARITY OF DIRECTION AND ORGANISATIONAL ALIGNMENT
How do you want your company to look and run in three to five years from now? And in one year? What are the vital few strategic initiatives to focus on? Make sure your leadership team is committed and fully aligned.
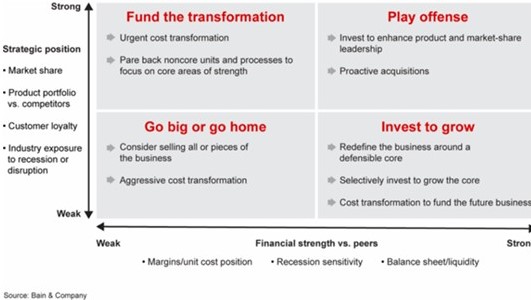
2. UNDERSTAND YOUR STRATEGIC AND FINANCIAL POSITION
Mapping out your plans depends on your strategic and financial position
(see Figure 2).
Figure 2. Mapping out your plans requires an assessment of your company’s strategic and financial position (Source: Bain & Company).
3. FREE UP “CURRENCY”
This is not about blunt cost cutting; the focus is on aligning your spending with your vision and strategic initiatives. Zero-based Alignment / Budgeting is a good way to select and make lean those activities that are fully aligned. The “currency” you free up can strengthen your balance sheet and support your investment agenda.
4. RETAIN YOUR CUSTOMERS
Retaining your customers is so much cheaper than acquiring new ones. The margin impact is significant. Explore ways to help your customers through the downturn and strengthen your relation with them. And be sure to focus on the right customers.
5. PLAN FOR VARIOUS SCENARIOS
Nobody knows when and how a downturn will unfold and when the economy will start to grow again. The winners have developed various scenarios, and they know how they should act in each scenario. This allows them to move quickly and decisively.
6. ACT QUICKLY AND DECISIVELY
Winning companies act quickly and decisively, both in the downturn and particularly in the early upturn when the opportunities start to arise. They have already created the “currency” to invest.
Not all companies have been equally aggressive in adopting new technologies. There are many opportunities here for improving efficiency or generating more value and thereby gaining a competitive advantage. The current COVID19 pandemic could well be an important catalyst.
This means that you have to be prepared for an economic downturn to come out as one of the winners. It should be noted that in these key actions, there is, in fact, no difference between being prepared for an economic downturn and running a business for continuous and maximum success. This picture is consistent with one that emerges from one of our other articles “How to create value in Industrials?”.
CHALLENGE
A second tier supplier of metal components for the automotive industry experienced great pressure upon its cost structure – and hence its prices. But a low price is not necessarily the decisive criterion. For many clients quality, speed and reliability are more important.
Meeting these criteria required not only a different approach to quality management, but also a simplification of the underlying processes. In fact, a “step change” was needed.
APPROACH
Our analysis was not about using a set of ratios to define the potential for improvement, we looked at the real details. We used a combined top-down and bottom-up approach.
Top-down goals were set that would determine the success of the business. Together with people involved in the business processes, we uncovered what was working well and needed to retained and what needed to be improved. Specific and measurable targets were set together with the managers involved; thus ensuring their buy-in.
In a joint team with client task-forces the implementation of required changes were addressed. Our distinctive approach ensured positive energy, local ownership and sustainability of results.
Many companies need to work hard to protect their bottom line. Driving down costs is a sine qua non – but done wrongly, it will damage the business. At the same time, growth drivers need funding to provide the means for future growth. Smart cost cutting will prune a company back to health and free up the cash to provide oxygen for growth drivers. Let’s explore how this is done.
Be explicit about value delivery
Be clear on the value to be delivered to your stakeholders both now and in the future. Design a strategy that enables resilience, irrespective of economic conditions. What products and services should you deliver? Work out an appealing vision that is also explicit about the mindset and behaviours that will create its success – this is a crucial factor that is all too often overlooked.
Align cost structure with vision
Once you have formulated your new vision, you will need to map out and understand the current activities and cost structures in detail. Work with five main questions: What activities can you not live without? What activities can you stop? What activities can you simplify or aggregate? Where can you redefine demand for activities? What new activities do you need?
Be clear on the must-haves and eliminate unnecessary or nice-¬to-¬have services and activities. Decide what can be outsourced, offshored or insourced, and how procurement can be rationalised.
Align and digitise the operating model
Design lean end-to-end processes
Answers to the questions listed above are the input for an iterative process that starts with the redesign of end-to-end business processes. Process mining is a tool that provides great insights into your current processes and will help you decide what to keep and what to adapt.
Drive down organisational complexity
Using the redesigned processes, assign responsibilities and accountabilities as low as possible in the organisation. Design logical, complete functions and think process flow, not department. Automate activities through software robots and integrate them as virtual employees with roles, accountabilities and reporting lines in the organisation. Create additional organisational layers only if they add value.
Create an effective reporting and meeting structure
Reduce the number of meetings held. Keep them focused and as short as possible. To improve a meeting’s effectiveness, be clear on what the meeting is for, who has to attend (and who not) and what information needs to be made available for the meeting. Each attendee should have the information that is required to do a good job – no more and no less.
Digitise
Capitalise to the max on the opportunities that intelligent automation provides and optimise the technology landscape. This drives down cost and improves both quality and speed.
Implement decisively
Design a roadmap from the current state to the future state and act decisively. Identify activities, but focus on results. If the activities don’t deliver the planned results, adapt the activities, not the timing of results delivery. Reinforce and develop the employees in their organisational roles – align their accountabilities and the implementation deliverables. The way the implementation is done shapes the mindset and behaviours in the organisation. Be sure this is in line with how the vision is formulated.
Maintain a relentless focus on cash and margin
Identify and deliver immediate operational cost measures to start generating cash. Move continuously from quick wins to more complex opportunities. Stabilise the supply chain, optimise working capital and optimise the supply chain processes. Keep on driving operational efficiency. Address the top line: address product and service offerings in line with your strategy and optimise pricing. Maintain a relentless focus on cash and margin throughout.
Provide oxygen for your growth drivers
Ensure that the growth drivers are well-positioned on the management agenda and the required resources are assigned and protected. Keep on driving their growth towards stretching KPI targets.

 On the right is the “P” column: turning the annual budget into a daily activity schedule. The lower horizontal part is the “D” area: the actual business processes where activities are done. On the left is the “C” column: reporting actual performance against the targets. In the middle is the “A” column: the daily, weekly, monthly, quarterly and annual meetings in which actions are formulated and decisions taken to drive actual performance to KPI targets based on the information and insights supplied through the reports. The fast cycles occur shift-to-shift, day-to-day and week-to-week. Above that the slower cycles are active.